Introduction
Atliq Hardware, a company supplying hardware peripherals to prominent clients such as Surge Store, Normad Stores, Excel Stores, and ElectricalSara Store, is experiencing a decline in sales. With its headquarters in Delhi and regional offices across the country, managing sales data effectively has become a growing challenge. The company’s reliance on Excel for data management has led to limited insights and inefficiencies. To address this, Atliq Hardware is transitioning to Tableau to derive actionable insights and make informed business decisions.
This blog details the step-by-step process of transforming Atliq Hardware’s sales management system from a manual, Excel-based approach to an automated, Tableau-powered solution. We’ll also explore the significance of an AIM’s grid, the implementation of ETL processes, and the creation of insightful dashboards.
Key Insights Required
To address sales decline and improve decision-making, Atliq Hardware identified key insights to extract:
Revenue Breakdown by Cities: Understanding the geographic distribution of sales.
Revenue Breakdown by Year and Months: Identifying seasonal trends and yearly performance.
Top 5 Customers by Revenue and Sales Quantity: Recognizing the most valuable clients.
Top 5 Products by Revenue and Quantity: Pinpointing the best-performing products.
Understanding AIM’s Grid
An AIM’s grid is a strategic framework used to align goals, stakeholders, and processes effectively. Here’s how AIM’s grid applies to Atliq Hardware:
Aims
Automate data gathering and insights generation.
Minimize manual efforts in managing sales data.
Provide actionable insights for data-driven decision-making.
Stakeholders
Sales Director: Uses insights for strategic planning.
Marketing Team: Aligns campaigns with top-performing products and regions.
Customer Service Team: Improves client interactions with customer-specific insights.
Data & Analytics Team: Ensures the accuracy and relevance of data analysis.
IT Team: Maintains and enhances the underlying software and infrastructure.
End Result
A comprehensive, automated dashboard delivering real-time sales insights.
Support for smarter, faster decisions to counteract sales decline.
Success Criteria
Insightful dashboards that present actionable sales data.
Improved decision-making with measurable outcomes like 10% cost savings.
Operational efficiency by saving 20% of analysts’ time previously spent on manual data gathering.
Implementation Process
Step 1: Transition to Tableau and Database Integration
Atliq Hardware’s IT team began by building a robust sales management system with a MySQL database at its core. The database serves as a central repository for all sales data. A data analyst connected Tableau to this database to facilitate the visualization of insights.
Step 2: Building a Data Warehouse
To ensure data is organized and analytics-ready, the data engineering team created a data warehouse. This process involved:
ETL Operations: Extracting data from the MySQL database, transforming it for consistency, and loading it into a warehouse built on Teradata.
Schema Design: Implementing star and snowflake schemas to optimize query performance.
Why OLAP?
Atliq Hardware adopted Online Analytical Processing (OLAP) due to its capability to handle complex queries and support multidimensional analysis. OLAP enables:
Fast retrieval of summarized data.
In-depth analysis across dimensions such as time, geography, and product categories.
Better decision-making through aggregated and drill-down views.
Step 3: Preliminary Data Analysis with MySQL
Before diving into Tableau, the team conducted a simple data analysis using MySQL. This analysis:
Explored raw sales data to identify inconsistencies.
Generated preliminary metrics for understanding trends and gaps.
Step 4: ETL and Data Cleaning in Tableau
Once connected to Tableau, the team performed further ETL operations:
Data Cleaning: Removing unnecessary data, filling missing values, and normalizing monetary amounts.
Data Transformation: Structuring data for intuitive visualization
Creating Dashboards in Tableau
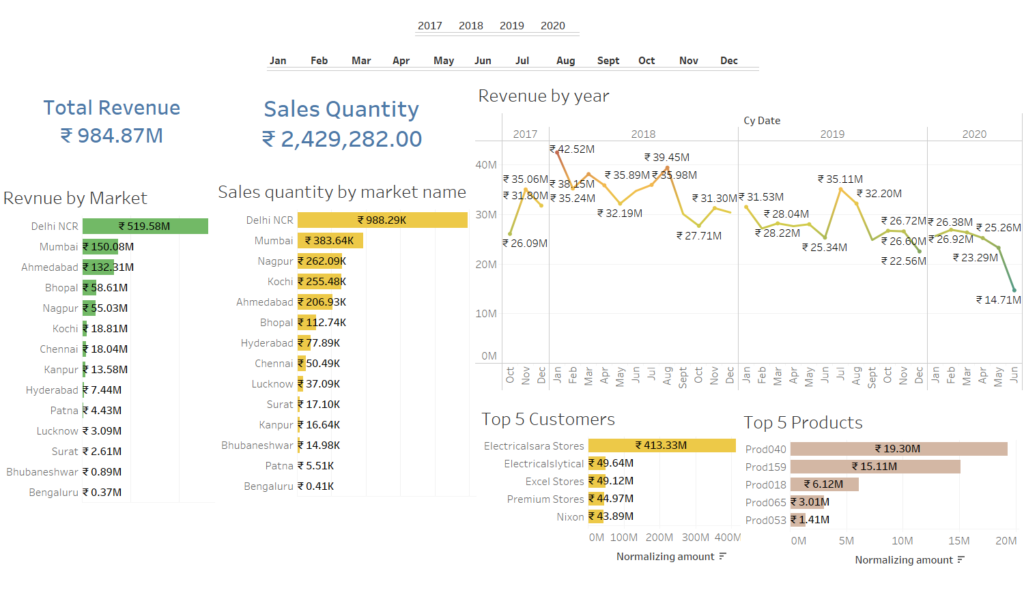
1. Revenue Analysis Dashboard
This dashboard provides a comprehensive view of revenue and sales trends:
Total Revenue: A KPI that highlights overall sales performance.
Revenue by Year and Month: Displays seasonal trends and growth patterns.
Revenue by Cities: Highlights geographic performance and opportunities.
Top 5 Customers by Revenue and Sales Quantity: Identifies key clients contributing to revenue.
Top 5 Products by Revenue and Quantity: Pinpoints high-demand products to optimize inventory.
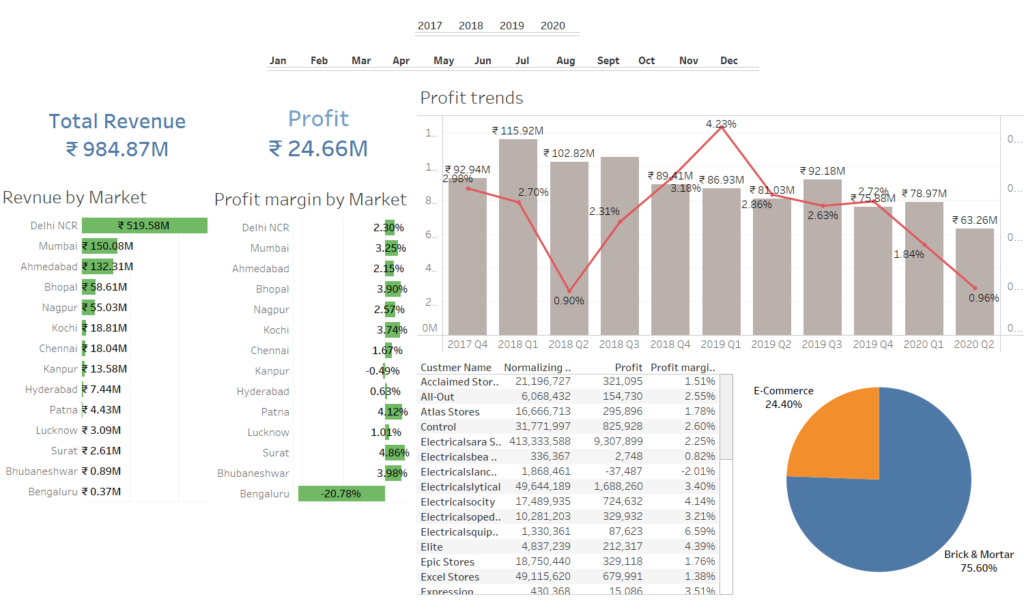
2. Profit Analysis Dashboard
Based on stakeholder feedback, the team created an additional dashboard focused on profit margins. This dashboard:
Displays profit trends by year, month, and region.
Highlights the most and least profitable products.
Offers actionable insights for pricing strategies and cost control
Results and Impact
The dashboards provided Atliq Hardware with:
Actionable Insights: The ability to drill down into sales data, identify trends, and make informed decisions.
Time Savings: Sales analysts saved 20% of their time previously spent on manual data gathering.
Enhanced Decision-Making: Better visibility into sales trends and customer preferences led to improved strategies.
Measurable Outcomes: Cost savings of 10% through targeted interventions and optimizations.
Conclusion
By transitioning to Tableau and implementing a robust data analysis framework, Atliq Hardware addressed its sales decline and unlocked new opportunities for growth. The combination of OLAP-based data warehousing, ETL processes, and dynamic dashboards enabled the company to gain deeper insights, enhance operational efficiency, and improve decision-making.
Atliq Hardware’s journey highlights the importance of leveraging modern analytics tools to stay competitive in a data-driven world. This transformation not only empowers stakeholders but also lays a solid foundation for future growth and innovation